
Virginia Tops the AI Data Center Ranking on a Score Weighted Toward Grid Carbon
TRG Datacenters ranked 24 states on AI infrastructure and put 40% of the score on how clean the grid is, which is the reason Virginia finishes first while Ohio holds more capacity.
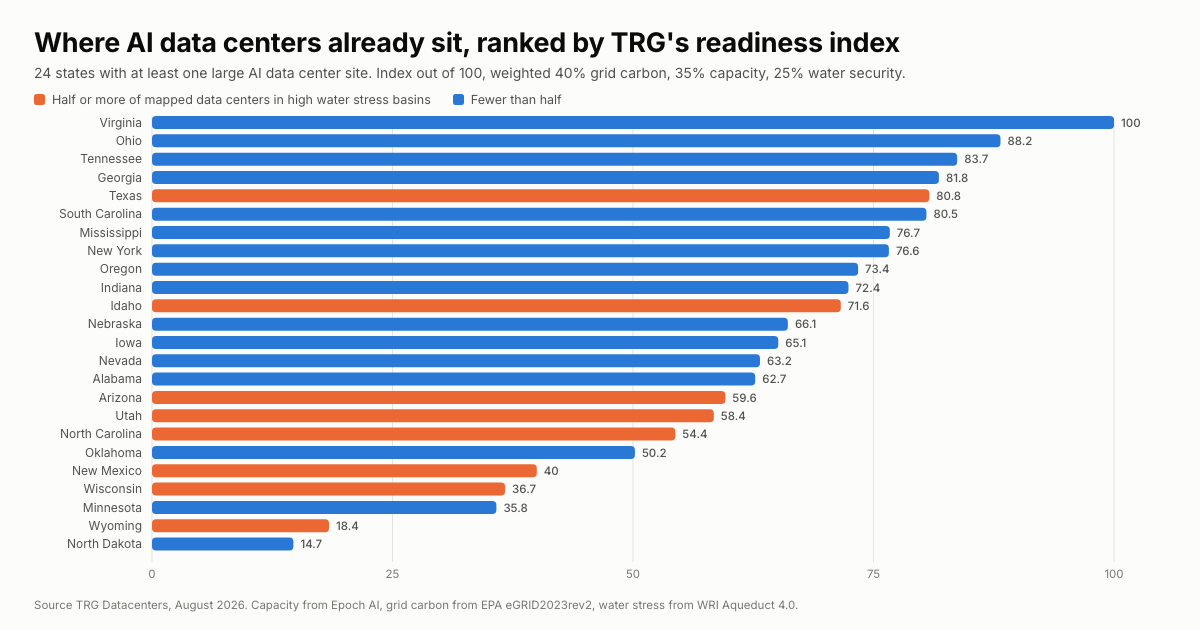
The compute behind an AI feature sits in a building somewhere, on a grid somewhere, drawing water from a basin somewhere. TRG Datacenters published an August 2026 study that maps where that infrastructure has landed, ranking the 24 states that host at least one large AI data center site. Virginia takes the top score of 100. Ohio follows at 88.2, then Tennessee at 83.7, Georgia at 81.8 and Texas at 80.8.
What the Ranking Puts First
The score is built from three inputs with uneven weight. Grid carbon intensity carries 40%, measured as pounds of CO2 equivalent per megawatt-hour on the regional grid serving that state’s data centers. AI data center capacity carries 35%, log-scaled so a single large state does not swamp the rest. Water security carries 25%, measured as the share of a state’s mapped data centers sitting in river basins where more than 40% of available water is already withdrawn.
Because grid carbon is the heaviest input, it explains the order at the top. Virginia’s data centers draw from a grid running at 597.8 lb CO2e per MWh. Ohio’s run at 916.1. Virginia hosts 7 large AI sites totaling 1,085 MW, more capacity than Georgia, New York and Oregon combined. Its estimated emissions come to 2.28 million tonnes a year. Ohio hosts 5 sites totaling 1,410 MW, the largest AI capacity in the study. Ohio’s estimated emissions come to 4.49 million tonnes a year, roughly double Virginia’s on a third more capacity.
Ohio’s compensation is water, since none of its mapped data centers sit in a high water stress basin. South Carolina, Mississippi, Alabama, Oklahoma, Iowa and North Dakota also register zero.
Tennessee is the outlier on grid load in the top five, with AI data centers accounting for 9.9% of the state’s electricity against 5.7% in Virginia and 1.9% in Texas. Nebraska, at 12th overall, carries the heaviest share in the study at 12.5%.
Where the Water Numbers Land
Texas builds more than any other state in the ranking, with 13 large AI sites, and 58.8% of its mapped data centers sit in high water stress basins. By mapped floor area, the figure reaches 69.2%. Texas still finishes fifth, because a 736.7 lb CO2e per MWh grid and 1,301 MW of capacity carry enough of the score to absorb the water penalty.
Further down the table, the water column turns lopsided. Idaho, Arizona, New Mexico and Wyoming each show 100% of mapped data centers in high water stress basins. North Carolina shows 94.1% and Utah 90%. Wyoming and North Dakota close the ranking at 18.4 and 14.7, held down by grids at 1,042.5 and 926.6 lb CO2e per MWh.
An AI development analyst from TRG Datacenters, who the study does not name, commented on the findings.
“AI can be supported and developed without spending the resources communities around data centers desperately need. When a data center takes all its water from a region that already doesn’t have enough, it is hard to talk about how productive or innovative its projects are. That’s what needs to be assessed first: how much electricity new infrastructure will take from the residents, and how much water. Any negative impact should be considered in close detail, not treated as an inevitability.”
The States That Are Missing
Inclusion depended on Epoch AI reporting at least one AI data center in the state, which left 24 of 51 in the study. Illinois, California, New Jersey, Washington and Colorado were excluded, and each of them hosts substantial conventional data center capacity. California alone shows 110 mapped facilities and 7.2 million square feet of mapped building area in TRG’s own raw data, with no AI site attached.
So what is the ranking measuring? Where AI-specific capacity has been sited so far. Not where the data center industry sits as a whole, and not where the next wave gets approved.
What This Means for Commerce
Merchants are adding AI to search, to support, to merchandising and to checkout, and buyers are starting to hand pieces of the purchase over to agents. Danny Kirk of ReddiReach walked through getting a brand noticed in AI search on the show. Talk Commerce covered that shift when ACI Worldwide found 7% of fashion shoppers would let an AI assistant buy without their approval. Each of those features runs on the capacity this study counts.
The operator-relevant signal in the table is where the friction accumulates. A state with a dirty grid draws carbon-accounting pressure, because enterprise buyers carry supplier emissions targets. A state with facilities in stressed basins draws local opposition, and local opposition drives permitting timelines and the cost of the next megawatt. Virginia, Ohio and Tennessee sit on the favorable side of both. Texas, Arizona and Utah carry a water exposure that has not slowed construction.
Does any of that change a merchant’s roadmap? No. The ranking informs how a merchant reads AI vendor pricing as it arrives, because the cost of compute tracks the cost of putting electricity and water next to a rack.
How TRG Built the Index
Grid carbon intensity comes from the EPA’s eGRID2023rev2, assigned by facility location and dated 2023. Capacity figures come from Epoch AI’s AI Data Centers database, dated July 2026. Water stress comes from the World Resources Institute’s Aqueduct 4.0 and the IM3 Open Source Data Center Atlas, the OpenStreetMap-derived facility map built at Pacific Northwest National Laboratory. Each metric was rescaled to 0 to 100 and combined, then rescaled so the leading state reads 100. Carbon intensity and water security use percentile ranking against the other 23 states, and capacity uses a log scale. Where a state had fewer than five mapped facilities, no water score was calculated and that 25% weight was redistributed.
TRG lists the limitations plainly. Capacity figures are estimates built from satellite imagery and permits, accurate within a factor of 1.4 about 80% of the time. Facility locations come from OpenStreetMap, which maps roughly 25% of known US data centers. OpenStreetMap’s coverage gap left Mississippi, Idaho and North Dakota without a water score. Water stress describes river basin conditions rather than water rights or measured facility use. Las Vegas reads low on the strength of the Colorado River passing through its basin, while Nevada’s entitlement from that river stays small and capped. Emissions factors are 2023 against generation and sales data from 2025. The weights are judgment-based, and TRG notes that alternative weights move the middle of the ranking while the top and bottom hold.
One labeling note for anyone opening the workbook. The public summary calls the output a Readiness Index, and the tabs inside the same spreadsheet call it the Final Burden Index Score. The arithmetic is identical either way, and the framing points in two different directions.
About TRG Datacenters
TRG Datacenters is a Texas-based data infrastructure provider running colocation facilities including a Houston campus. The company publishes research on data center and AI infrastructure trends. The full ranking of all 24 states is published with the underlying raw data, the weightings and the methodology. Data credit to TRG Datacenters.